Menu

Split testing is a technique to get the best version of your landing page that sounds like something that is reserved for tech-savvy bloggers and marketers. Spoiler alert: ANYONE can do it. In this article, I’ll talk about how to split test landing pages in 6 simple steps and list some ideas of what landing page elements you can test.
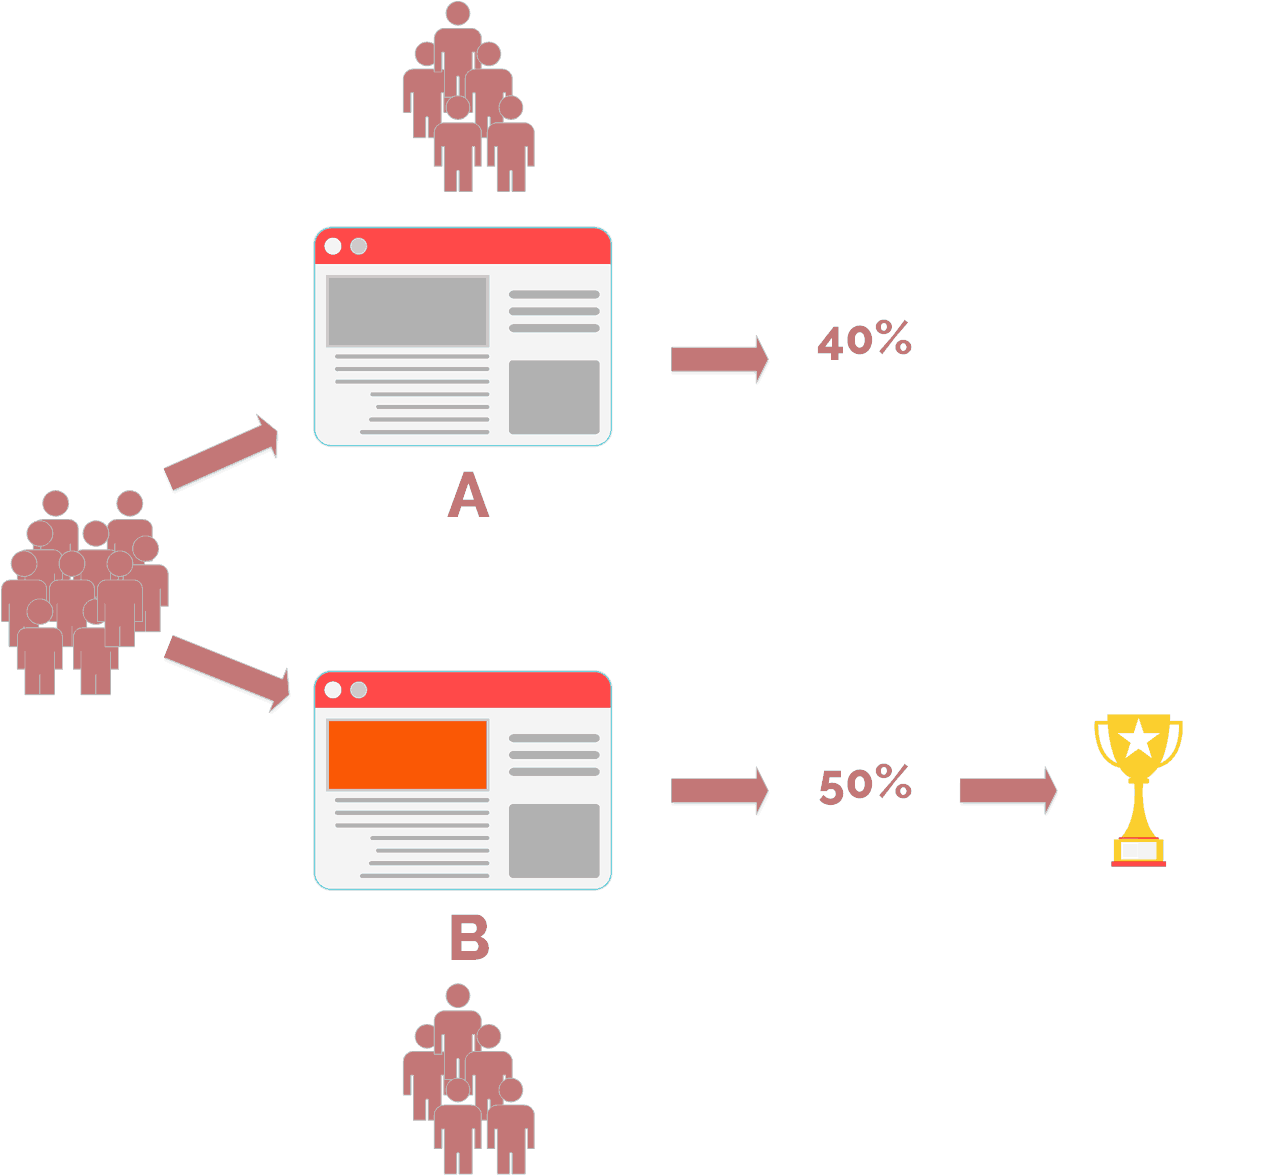
Split testing, or A/B testing, involves testing an original design against an alternate version of that design to see which one performs better with respect to a certain goal. The original design is often called the control, or A, while the alternate version is known as a variation, or B. Split testing can be done to all sorts of marketing tools, such as ads, homepages, email campaigns, and the focus of this article, which is landing pages.
Make no mistake, split testing your landing page is long, hard work. So why do it?
Split testing allows you to understand your readers and visitors better. They’re telling you what they like and don’t like about your landing page. Best of all, they’re doing it in a way that you can measure objectively. If you can measure it, you can change it.
Ultimately, the goal is to improve your landing page design to enhance your target audience’s experience, which translates into a consistently high conversion rate.
Is this the best way to improve my lead generation?
A/B testing your landing page isn’t the only way to improve your lead generation. Maybe you need to improve your lead magnet. Maybe you need to work on getting traffic to your blog. Maybe you need to apply landing page best practices on your landing page first. Make sure you’ve done everything else the best way that you could before split testing, because it is the farthest thing from an easy solution.
Are my expectations realistic?
Some bloggers do manage to boost signups by 100% or even 1000% through split testing. But it’s important to note here that these big numbers are the exception rather than the rule. It’s even more unrealistic to expect this kind of numbers on your first experiment. More likely, you’ll have to do many failed tests before you get there. Thus, you need to set realistic expectations: aim for a low, but sustainable, increase in conversions.
Have I done my research?
Again, so-called landing page best practices exist for a reason. Sure, sometimes they don’t work for your niche, but it’s always advised to do your homework first and do what successful bloggers and marketers are doing before you veer off the beaten path.
Do I have the time and resources to do this?
Landing page testing software, the good ones, will cost you. Plus, it takes several weeks to run a single test. Are you ready to dig into your data, find out why your visitors aren’t converting, and then think of a landing page testing strategy?
If you answered “YES” to all these questions, then you’re ready to begin split testing your landing page.
Having a sound landing page testing strategy will help you determine what’s best for your landing page in a systematic way, instead of just having random ideas, applying changes to your landing page, praying for success, and leaving it until the next random idea hits you.
It’s important to mention at this point that there are two main types of landing pages. The type you probably started out with are called lead-generation landing pages. These are landing pages that aim to collect visitors’ email addresses so they can be part of your mailing list for updates and future marketing when the time comes. The call to action (CTA) here gives them your lead magnet in exchange for their email addresses and other relevant information so they can be part of your mailing list. This is what it means to “convert”; to go from a casual visitor or reader into a lead.
The other type of landing pages is called click-through landing pages. These are displayed when you advertise a product or a service. The aim of this type of landing page is to convince the reader to buy that product or service, so the CTA here leads to a checkout page that asks for their credit card information. Because this involves a greater investment on the reader’s part, click-through pages are normally longer and have much more information than lead-generation pages.
For simplicity, I’ll only talk about lead-generation landing pages in this post.
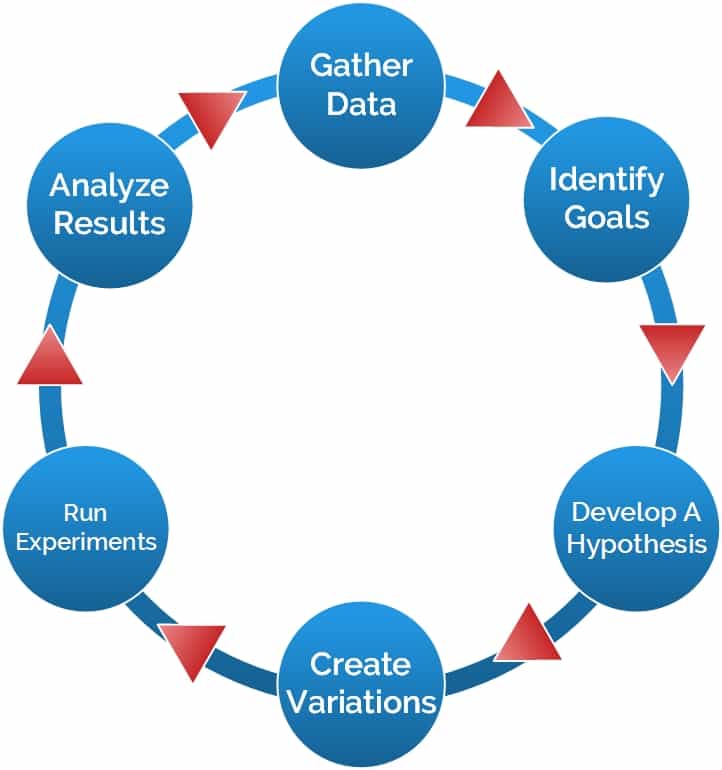
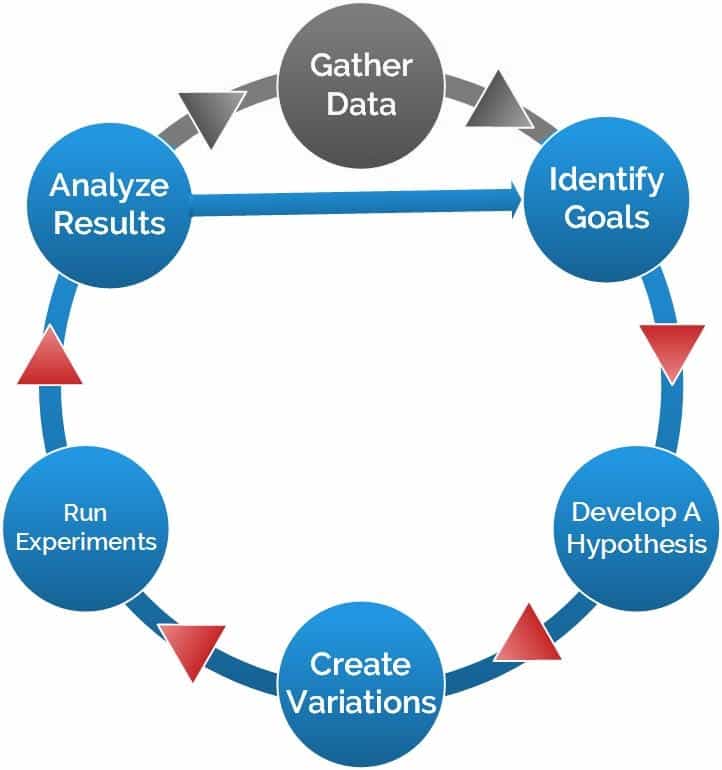
There are 6 steps to the testing process. In a nutshell, you’ll need to know how your visitors are behaving on your page, spot areas that can use improvement, and then formulate a hypothesis. Based on your hypothesis, you then create alternative versions of your landing page, run the test, then study the information you collected from running the test.
Click To Zoom
Before you start any sort of testing, it’s important to know how your visitors are currently interacting with your landing page. Fortunately, you have numerous tools at your disposal to help you gather the data you need before you proceed with testing.
Recommendations: Google Analytics, Clicky, Heap
Website analytics software collects, measures, and analyzes the traffic to your landing page. Just some of the information it gives include page views, average time on the page, bounce rate (i.e., how often your visitors navigate away from your landing page), number of new visits, where on the internet your visitors come from (search engine result, from a link or ad on your blog, links from another website, social media, paid ads), where in the world your visitors come from, and what device they used to look at your landing page.
All this information allows you to have an idea of how your visitors found your landing page, how long they stay, and what they do (i.e., if they go on to click on your CTA or close it).
Recommendations: Crazy Egg, Heatmap.me, Hotjar
Website analytics give you part of the story, but it isn’t complete. Heat maps complete the story by showing you how your visitors actually engage with your landing page elements.
They tell you what users see on the page, what they read, what they pause to look at, what they skip over, how far down they scroll before they convert or leave your page, where they click (very useful for catching distractions), and how long they fill out your form. Some software even capture videos of your page as a visitor interacts with it.

Image Created by Karsten Adam at the German language Wikipedia, via Wikimedia Commons | CC BY SA 3.0
Most heat map software track mouse movements over a period of time and then present it as, you guessed it, heat maps over the page you’re tracking. In case you’re wondering, mouse movements have been proven to be a good approximation of eye movement.
Eye tracking is the gold standard of gathering data on what visitors actually look at, but you can’t possibly track everyone who visits your site (and even if you could, that sounds like a serious breach of privacy). Eye tracking services are available, but are more costly. Plus, you can’t be certain that the participants they hire are your target audience.
Recommendations: Qualaroo, Qeryz, Informizely
You can base your testing on excellent data from website analytics and heat maps, but sometimes the best information comes from your visitors themselves.
On-site surveys ask questions from your visitors while they’re on your landing page. They’re subtle pop-up boxes that appear to the visitor based on rules that you’ll define, such as time spent on the page or mouse movement toward the Close button.
You can ask questions like “How clear are you on what this page is offering?” or “Is there anything holding you back from signing up?” when they move to close the page. Open-ended questions are best, but visitors might find them to be too much hassle to answer and you might not get the answers you were looking for. Try asking yes/no questions or give them choices instead of a blank space to type.
Surveys are qualitative data, and you might not want to trust this data when you have more objective data from your analytics and your heat maps. But qualitative data is just as important as quantitative, especially if your landing page doesn’t have much traffic yet.
You don’t have to wait for your software to generate a heat map when you’re learning straight from your visitors that they find your page confusing, or they’re not really clear on what you’re offering. You can just straight up change that aspect of your page.
Once you have gathered enough data about how visitors interact with your landing page, you can now identify your testing goals.
Knowing how your visitors behave when they are on your landing page will help you understand if your landing page elements successfully convinced them to click your CTA or if you need to change something to get them to convert.
Below are some examples of data you can obtain from the tools above and how you can use it to pinpoint deficiencies in your landing page.

Here are some questions you can ask your visitors while they’re on your landing page.
The ultimate goal of your lead-generation landing page is to generate leads; that is, to get your visitors to give you their email addresses in return for something valuable, i.e., your lead magnet.
Now that you know how your visitors are behaving on your landing page, you can now define your testing goal: what needs to change to convince more visitors to convert?
For example, from the data you gathered, you noticed that your visitors are reading the headline and nothing else. Thus, your goal is to change the headline to increase conversion rate.
Click To Zoom
Whatever goal you end up defining, it’s important that you only focus on one element at a time. If you test both your headline copy and your benefits copy, you won’t know which factor contributed to any change in your conversion rates. You can always do another round of split testing with another element of your landing page.
Once you’ve defined your testing goal, you can now formulate a hypothesis. Defining your hypothesis will help you come up with variations on your landing page that will give you meaningful results.
Following our example, your goal is to improve your headline, and your hypothesis may be that changing up your headline will increase conversion rate. Here’s an example of it in action.
Problem: 50% of visitors bounce off the landing page after reading the headline without reading anything else.
Hypothesis: Visitors don’t read past the headline. Changing the headline copy to a more persuasive one will convince visitors to stay on the page longer and increase conversion rate.
To guide you when making your hypothesis, remember the characteristics of a good hypothesis.
It seems unnecessary to write out your hypothesis, but taking the time to do so will ensure that your testing has clear direction by making you focus on the problem, your proposed solution, and what results you hope to gain.
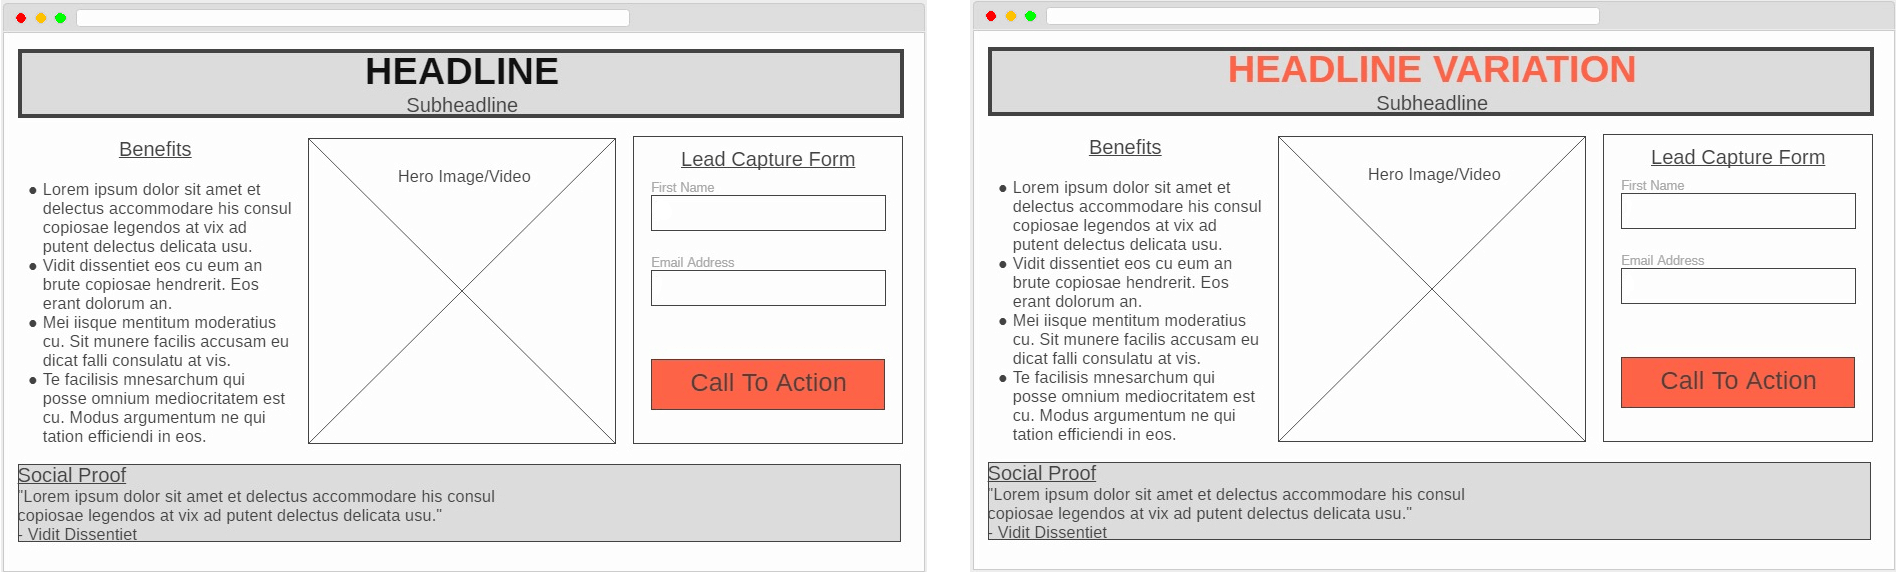
We come to the fun part (well, it depends on your definition of “fun”): creating a new variant of your landing page to implement your idea and put your hypothesis to the test.
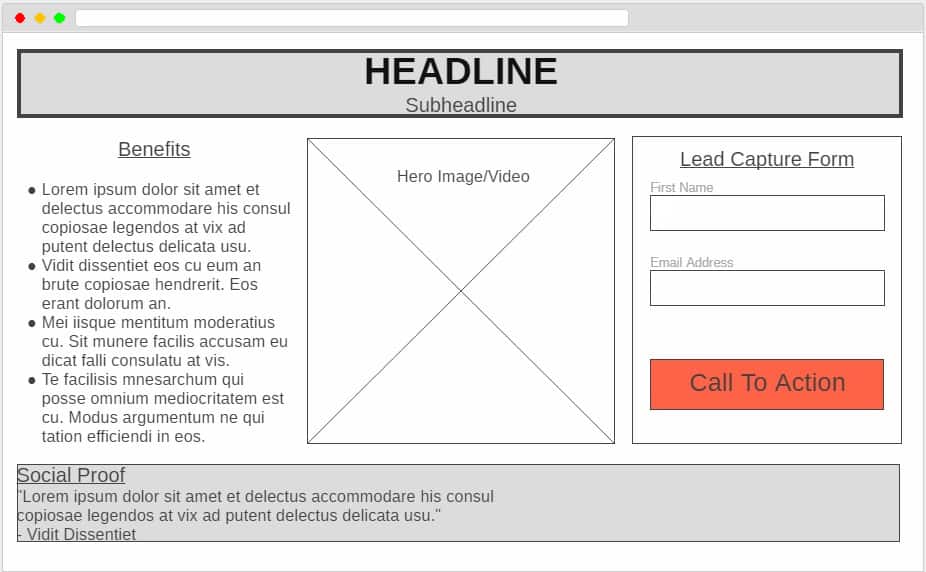
Following our example, you’ll want to make a variation of your original landing page that has all the exact same elements except for the copy.
Click To Zoom
I’ve mentioned this before, but I’m mentioning it again: test only one element at a time. You can’t claim that your test is accurate if you test more than one element in a single round. In our example, it’s going to be hard to pinpoint the cause of an increase or decrease in your bounce rate if you tested your headline and hero image.
Plus, it’ll take longer to test to have a statistically significant of visits per page. If, for example, you have the original landing page plus a headline variation plus a hero image variation, you’ll have to test 4 pages (original landing page, original headline x variation of hero image, variation of headline x original hero image, variation of headline x variation of hero image).
This will take twice as long as split testing your original landing page against a variation of your headline because of the sample size you’ll need per page (more on this in the next section).
If you choose the right tools to run your experiments, the actual experimentation phase should be relatively straightforward. So let me start with recommending tools that will help you run your experiments painlessly.
Visual Website Optimizer (VWO) offers a complete suite of A/B testing and conversion optimization tools, but these are aimed at small to medium businesses. They do have free tools that bloggers with hardly any budget can use, namely, the A/B Test Significance Calculator, A/B Test Duration Calculator, and Landing page Analyzer.
Google Analytics has a feature called “Content Experiments” that allows users to split test page variations right in the program. This is absolutely free to use, but may have a bit of a learning curve.
Lander is an affordable option that allows you to create and test landing pages. Its easy-to-use editor and integration with third-party tools make it a practical tool for creating and testing landing pages.
Your sample size needs to be large enough so you can be sure that your results are reliable. Your sample size is the number of visitors to each of the pages you’re testing, i.e., your control and your variation. To determine the sample size you need, you need to know beforehand 1) the statistical significance you’re aiming for, 2) your baseline conversion rate, and 3) desired minimum detectable effect.
Before your eyes glaze over, let me first try to explain the concept of statistical significance. In simple terms, it is the measure of how sure you are that your test results are not a coincidence. For instance, when we say a test result has 80% statistical significance, you can be 80% sure that your results (whatever they are) are due to the change you did. However, this means that there is a 20% chance that your results were a fluke.
Thus, the higher the statistical significance, the more confident we are about the results of the experiment. The higher the statistical significance you’re aiming for, the greater the sample size you’ll need; that is, the number of visitors to each of the pages you’re testing.
Most marketers stop testing when statistical significance reaches 95% or greater. Don’t make this mistake. Significance levels change throughout the test duration. Today, statistical significance may be 98%, and then 2 days later it could drop to 60%. There are other factors to consider before you stop testing (more on this later).
Your baseline conversion rate is the current conversion rate of your original page. It’s the number of visitors that click your CTA over the total number of visitors. This should be easily given by Google Analytics if you’ve set it up.
Your desired minimum detectable effect is actually up to you; it’s the minimum change in conversion rate that you want to be able to identify. Keep in mind that the smaller this number, the more precise your results will be. However, to achieve this, you’ll need a larger sample size before you can conclude the test.
For example, if you set your minimum detectable effect to 10% before the test and then your testing software says that your variation page is converting at 8% higher or lower than the original, you can’t trust the result. You can only be confident if the change in the conversion rate is greater than 10%.

Me right now
Going back to your sample size, you can input these numbers in a calculator (Optimizely has a free one) or if you’re comfortable with statistical analysis, you can compute it manually (here’s how). Most landing page tools should also have a built-in calculator to make it easier for you.
Everything you need for doing your experiments should be in place before you make your experiment live. Here’s a rundown of what you need to verify before you commence testing.
One of the most difficult things in split testing is knowing when you’re done with that round.
End the test too early and you increase your chances of picking the wrong winner and making all the wrong decisions on your landing page. End the test too late and you risk showing your variations to the wrong people, rendering your results invalid.
So how do you know you’re done?
Based on best practices of marketers everywhere, meeting these 3 criteria normally means that you’re done testing:
I emphasized “full” weeks because if you don’t test a full week at a time, your results may be skewed because of normal fluctuations in the number of conversions on different days of the week and even different times of the day.

Don’t call the results too soon. If you can reach 4 full weeks of testing, that should be good enough. You can even extend to another week or two if you haven’t reached sample size, but 2 months to run a test is too long; many of your audience would have already cleared their cookies, making it likely that they are shown the wrong version and thus screwing up your data.
When you already have already achieved the needed sample size, and you still haven’t reached statistical significance, this likely means that there’s no significant difference between the original and the variations. This can happen a lot, especially if you’re testing low-impact changes, so don’t be discouraged. Change your hypothesis (focus on high-impact aspects!) and test that instead.
When you’re done testing, you can now analyze the results of your test.
Your testing software will normally have lots of data for you to go through, and it can be overwhelming. Here are some terms that you’ll likely encounter on your landing page software and what they mean.
Of course you’ll want to look at the conversion rates of your control and variation to compare them and find if there’s been any improvement. However, looking at some of your other data will give you more useful insights on your visitors. Remember that split testing should also help you gain new knowledge about your visitors and your target audience. Here are some tips to help you get more out of your data.
For instance, you might want to look at how often your visitors clicked on your explainer video, if you have one on your page. If you’re not testing for your explainer video, i.e., you have the same one on both your control and your variant, you might find some interesting correlation between those who clicked the video and then converted, regardless of which page was shown.

You can also compare heat maps of your control page and your variation, disregarding conversion rates temporarily. How far did they scroll down on your control page? Your variation? Are there differences in how your visitors engaged with the page? Did they end up looking at your image a little longer? Or was there a particular benefit they lingered on? Did they hesitate on your form somewhere?
If your landing page testing tool doesn’t have this capability, you can get this data from Google Analytics, if you correctly integrated it with your tool. For instance, you might find that mobile users have a significantly higher conversion rate than that of desktop users. It may not be very obvious, but can make for a great hypothesis for another A/B test.
Where did your visitors come from? Social media, your blog posts, or ads on your sidebar? Who were most likely to convert? Were there differences in how they engaged with your variation?
Your test can go one of four ways. Here’s what to do when you get each of these results.
If your variation outperforms your control landing page, you can say that your hypothesis was correct. You can now implement this landing page for all your visitors and retire the original one. On your next A/B testing, this will now be your control page. Your next goals and hypothesis will now be based on this version of your landing page.
If your control landing page outperforms your variation, don’t fret. Your hypothesis was incorrect, but you did gain plenty of insights into your visitors’ behavior. Disable the variation and continue using the original landing page for all your customers. On your next A/B testing, this will remain your control page.
If neither the control nor the variation is statistically better than the other, then you’ll have to mark the test as inconclusive. It means the variation isn’t better or worse than your control page.
You can use the data to design a new A/B test varying the same element, or you can move on to another element that you think will have a greater impact on your landing page. In the meantime, continue using the original landing page for all your customers, and you can use this as your control page.
Technical failures do happen. There are so many systems in place when doing an A/B test that somewhere in the testing process, something may break. This may be frustrating and you might want to give up on testing altogether, but this is all excellent learning experience for you.
Pinpoint what went wrong, troubleshoot it, and make sure it doesn’t happen again. Repeat your split test after correcting the errors.
Every page can perform better. Yes, even the one that just emerged as winner in your test. Just because it won this round doesn’t mean it’s the best ever. So the next step you take after a round of split testing is to create other variants to challenge that winner, which is now your control.
If you’re determined to improve the particular element that you’ve just tested, create another variant with the same element changed. In effect, you’ll go back to Step 4 and go all the way to Step 6. You can repeat this until you’re satisfied that you have the best version of that element.

Click To Zoom
If you want to move on to another element of the page, you can analyze all the data you have gathered, go back to Step 2, and go all the way to Step 6.
Click To Zoom
Now that you know how to test, the next thing you’ll need to think about is what to test. I did mention earlier that if you’re just starting out and don’t have a lot of traffic to your site, you’ll work much more efficiently if you test the elements on your page that are most likely to make a difference in your conversion rate.
Below is a list of ideas that you can use as a starting point. Bear in mind, though, that you should still define your goals and formulate your hypotheses on data you should have gathered. Some of these may work for your page, others probably won’t, and that’s okay.
As I’ve previously mentioned, the headline is the most powerful part of your landing page. This is the first thing that your visitors see and the first impression they’ll have of your landing page and what you have to offer.
What To Test
The next element you’ll want to test is your CTA button. The right call to action can drive your conversion rate up.
What To Test
Subheadlines are essential and need to work with your headline to keep your visitor on the page.
What To Test
This is where you can explain your lead magnet and how it can help them. This is also where you convince them that it’s worth their email address.
What To Test
It’s possible that your visitor can get as far as your form and still not convert. From hundreds of case studies, it’s been established that placing more form fields decreases conversion rate. This doesn’t mean you can’t optimize this element. You’ll want to ask for as much information is necessary.
What To Test
Visitors tend to trust what other people say about you and your blog; sometimes even more than they trust what you have to say. Including testimonials may just be the extra push your visitors need to convert, or they might think your testimonials are fake and they might trust you even less.
What To Test
Imagery can be functional, or they can add aesthetic appeal. Or do both. Whatever your intended purpose, test your imagery to make sure it adds value to your landing page.
What To Test
The design of your landing page should help your copy accomplish your primary goal, not distract from it or obscure it.
What To Test
To recap, here are the steps on how to split test landing pages:
Click To Zoom
I also gave a list of ideas of what to test on your landing pages. Hopefully, this information was helpful in getting you started on your split testing. Here are some final thoughts before you go over your data and start planning your test.
When you do further research on A/B testing, you’ll read case studies of companies who increased their conversion rates by 100% or even 500% by changing the color of their CTA button. But behind every huge success is a hundred failed tests; that is, tests that are inconclusive or resulted in negligible changes to their conversion rate.
Like I said earlier, failed tests aren’t total disasters. Analyze those test results and break them down. They should still tell you information about your visitors that you wouldn’t have learned if you didn’t run those tests.
Let’s face it, we’re all running on limited time and resources. Even more so if you’re just starting out. You can look at your landing page and see a dozen things you can change. But that’s an inefficient method of testing.
You need to focus on elements that have the highest impact on your goals. This is rarely apparent upfront, but try to use your common sense and trust your intuition to figure out what these are. These are usually your headline copy and your CTA copy, but there can be others, depending on your target audience.
Prioritization is key. You want to be testing elements that will have a huge bearing on your ultimate goal, not running tests with 41 shades of blue to find the best shade to use on your outbound links (true story). You theoretically could, of course, but do you really want to spend time and money on such frivolous tests?
If your data gives you new ideas that you think can make an impact, go ahead and test them. The more information you gather, the better your landing pages will turn out to be. It never stops at the first A/B test.
Go through your data, brainstorm your landing page elements that you think should be split tested, and then formulate tests for these elements. When you get used to testing, you won’t want to stop.
Split testing is not a quick fix. It’s a continuous feedback loop. Every time a test ends, it’s time for you to start a new one because of all the data and insights you gathered.

A good mindset to adapt is that your landing page will never be 100% optimized for conversions. There will always be steps you can take and things you can change to impact your page’s conversion rate.
Thinking of setting up your first A/B test? Or have you started split testing your landing page? How was your experience? Which tool did you use? How has my article helped? Share it in the comments below!
JoAnne is your average, everyday, sane stay-at-home mom who believes in the power of the internet to make dreams come true. She has an insatiable appetite for chocolate, as well as all things internet marketing. She keeps up with the latest trends in blogging, affiliate marketing, e-commerce, and more.
